
1. Download Gatling
2. Install Java
3. Copy a small simulation file
4. Edit the simulation to suit your needs
Recently I was working on an Azure Function Application and there were some performance requirements:
The Function Application must be able to service 750 connections in a day within normal response times
The Function Application must be able to service 100 simultaneous connections within normal response times

I was very sure the Function Application could do both, but how could I prove it? 🤔 I’ve been wanting to use the Gatling tool for a while, and now seemed like the perfect opportunity to try it out!
What is Gatling?
So what is Gatling then? From their own website:
Gatling is a powerful open-source load testing solution.
Gatling is designed for continuous load testing and integrates with your development pipeline. Gatling includes a web recorder and colorful reports.
Gatling can be used to make API, or general HTTP, calls in a large scale way. You can configure exactly what to send and how often. Gatling will then give you a nicely formatted aggregate of the results including some neat reports and graphs. I really liked that it was open-source, but more importantly it was designed to be used in continuous integration scenarios. Which meant I could share my test files with other developers in Source Control.
However, one thing that initially put me off was that the configuration files were written in Scala. I have never written Scala, nor did I want to learn, but the Gatling documentation and tutorials were really good. I mean REALLY good. I could understand from the examples what they were trying to achieve, and the documentation would help me find the bits I didn’t know. Here’s an example from their tutorial:
package computerdatabase // 1

import scala.concurrent.duration._

import io.gatling.core.Predef._ // 2
import io.gatling.http.Predef._

class BasicSimulation extends Simulation { // 3

  val httpProtocol = http // 4
    .baseUrl("http://computer-database.gatling.io") // 5
    .acceptHeader("text/html,application/xhtml+xml,application/xml;q=0.9,*/*;q=0.8") // 6
    .doNotTrackHeader("1")
    .acceptLanguageHeader("en-US,en;q=0.5")
    .acceptEncodingHeader("gzip, deflate")
    .userAgentHeader("Mozilla/5.0 (Windows NT 5.1; rv:31.0) Gecko/20100101 Firefox/31.0")

  val scn = scenario("BasicSimulation") // 7
    .exec(
      http("request_1") // 8
        .get("/")
    ) // 9
    .pause(5) // 10

  setUp( // 11
    scn.inject(atOnceUsers(1)) // 12
  ).protocols(httpProtocol) // 13
}
Even with only a quick glance, you can kind of make out what it was trying to do
- Set the Base URL (4)
- Add some Headers to requests (5 & 6)
- Set the HTTP Request Method (8 & 9)
- Setup how many requests to send (
atOnceUsers(1)) (12)
And for most people starting out with Gatling, that’s enough. So let’s get started with Gatling and create our own test.
Installing Gatling
Gatling is offered in two flavours; the Enterprise edition, and the Open Source edition which is the one we will be using. This downloads a zip file with a basic Gatling Installation. At the time of writing, version 3.6.1 is the latest. Extract out the ZIP file somewhere, in my case C:\Source\gatling-charts-highcharts-bundle-3.6.1-bundle and then run Gatling;
C:\Source\gatling-charts-highcharts-bundle-3.6.1-bundle> .\bin\gatling.bat
GATLING_HOME is set to "C:\Source\gatling-charts-highcharts-bundle-3.6.1-bundle"
JAVA = "java"
'java' is not recognized as an internal or external command,
operable program or batch file.
Press any key to continue . . .
Oh no! So Scala runs in a Java Virtual Machine (JVM) so of course it needs Java. Gatling lists the following compatible Java versions:
Gatling supports 64bits OpenJDK 8 and OpenJDK 11 with HotSpot. Other JVMs such as JDK 12+, client JVMs, 32bits systems or OpenJ9 are not supported.
So download an install an appropriate version of Java (Due to the licensing shenanigans with Java, I can’t really recommend one for you). Once it’s installed we can run Gatling again:
C:\Source\gatling-charts-highcharts-bundle-3.6.1-bundle> bin\gatling
GATLING_HOME is set to "C:\Source\gatling-charts-highcharts-bundle-3.6.1-bundle"
JAVA = "java"
Choose a simulation number:
     [0] computerdatabase.BasicSimulation
     [1] computerdatabase.advanced.AdvancedSimulationStep01
     [2] computerdatabase.advanced.AdvancedSimulationStep02
     [3] computerdatabase.advanced.AdvancedSimulationStep03
     [4] computerdatabase.advanced.AdvancedSimulationStep04
     [5] computerdatabase.advanced.AdvancedSimulationStep05
Nice! The default Gatling installation comes with some default scenarios so you can start straight away. These are in the user-files/simulations directory. But this is a getting started guide, so lets create our own simulation file.
Creating our own Simulation
So lets create a simulation to call my blog (https://sarti.dev). First we need to create the simulation file. Create a file called sartidev_test1.scala
package gatlingBlog

import scala.concurrent.duration._

import io.gatling.core.Predef._
import io.gatling.http.Predef._

class SartiDevSimulation1 extends Simulation {
  val httpProtocol = http
    .baseUrl("https://sarti.dev")

  val scn = scenario("SendSimpleQuery")
    .exec(
      http("root_request")
        .get("/")
    )

  setUp(scn.inject(
    atOnceUsers(1)
  ).protocols(httpProtocol))
}
Let’s break this down;
package gatlingBlog
The optional package statement is used to logically group simulations together. In this case, all of the simulations for this blog post will be in the gatlingBlog package.
import scala.concurrent.duration._

import io.gatling.core.Predef._
import io.gatling.http.Predef._
Next we import the default Gatling Scala packages so we can use them.
class SartiDevSimulation1 extends Simulation {
  ...
}
Then we create our simulation called SartiDevSimulation1. This is a Scala class and extends (or “inherits from”) the Gatling Simulation class. This is how some of the “magic” happens later. Now we start defining our simulation
  val httpProtocol = http
    .baseUrl("https://sarti.dev")
We create a protocol object, in this case for the HTTP protocol, and assign it a URL which will be the base for any other queries. This is also where you would put request headers and we’ll show that later. For now, we only need the URL.
  val scn = scenario("SendSimpleQuery")
    .exec(
      http("root_request")
        .get("/")
    )
Next we need to define the test scenario. In this case, we are just doing a plain old HTTP GET request to the root URL. This is exactly what a browser would request when you open my blog. This scenario can be extended with multiple calls or POSTs or delays. For now though a simple GET request will do.
  setUp(scn.inject(
    atOnceUsers(1)
  ).protocols(httpProtocol))
And lastly we setup the scenario to send only one request (atOnceUsers(1)) over the protocol we configured. This is where we can set the number of sustained concurrent connections or delays. For now we just want to test the simulation even works.
Now lets run the simulation. We pass in the simulation directory for our new file on the command line. For this example, I created my Gatling files in C:\Source\code-glennsarti.github.io\gatling
C:\Source\gatling-charts-highcharts-bundle-3.6.1-bundle> .\bin\gatling.bat --simulations-folder C:\Source\code-glennsarti.github.io\gatling\
GATLING_HOME is set to "C:\Source\gatling-charts-highcharts-bundle-3.6.1-bundle"
JAVA = "java"
gatlingBlog.SartiDevSimulation1 is the only simulation, executing it.
Select run description (optional)

Simulation gatlingBlog.SartiDevSimulation1 started...

================================================================================
2021-09-13 21:14:15                                           1s elapsed
---- Requests ------------------------------------------------------------------
> Global                                                   (OK=1      KO=0     )
> root_request                                             (OK=1      KO=0     )

---- SendSimpleQuery -----------------------------------------------------------
[##########################################################################]100%
          waiting: 0      / active: 0      / done: 1
================================================================================

Simulation gatlingBlog.SartiDevSimulation1 completed in 1 seconds
Parsing log file(s)...
Parsing log file(s) done
Generating reports...

================================================================================
---- Global Information --------------------------------------------------------
> request count                                          1 (OK=1      KO=0     )
> min response time                                   1086 (OK=1086   KO=-     )
> max response time                                   1086 (OK=1086   KO=-     )
> mean response time                                  1086 (OK=1086   KO=-     )
> std deviation                                          0 (OK=0      KO=-     )
> response time 50th percentile                       1086 (OK=1086   KO=-     )
> response time 75th percentile                       1086 (OK=1086   KO=-     )
> response time 95th percentile                       1086 (OK=1086   KO=-     )
> response time 99th percentile                       1086 (OK=1086   KO=-     )
> mean requests/sec                                    0.5 (OK=0.5    KO=-     )
---- Response Time Distribution ------------------------------------------------
> t < 800 ms                                             0 (  0%)
> 800 ms < t < 1200 ms                                   1 (100%)
> t > 1200 ms                                            0 (  0%)
> failed                                                 0 (  0%)
================================================================================

Reports generated in 0s.
Please open the following file: C:\Source\gatling-charts-highcharts-bundle-3.6.1-bundle\results\sartidevsimulation1-20210913131412780\index.html
Press any key to continue . . .
There’s a lot of text there but the important part is that the request was successful. How do we know? because of the request count
---- Global Information --------------------------------------------------------
> request count                                          1 (OK=1      KO=0     )
OK=1 means there was one request that returned a successful HTTP response code (200 OK)
And the response time from my blog was 1086ms (🎉 Yay for Australian Internet and vast distances)
> mean response time 1086 (OK=1086 KO=- )
This all nice, but doesn’t help. What if we sent 100 simultaneous requests? Well we change one line;
From
atOnceUsers(1)
To
atOnceUsers(100)
And we run the simulation again using the same command line and we get the following results:
================================================================================
---- Global Information --------------------------------------------------------
> request count                                        100 (OK=100    KO=0     )
> min response time                                    631 (OK=631    KO=-     )
> max response time                                   2954 (OK=2954   KO=-     )
> mean response time                                  1405 (OK=1405   KO=-     )
> std deviation                                        371 (OK=371    KO=-     )
> response time 50th percentile                       1468 (OK=1468   KO=-     )
> response time 75th percentile                       1643 (OK=1643   KO=-     )
> response time 95th percentile                       1913 (OK=1913   KO=-     )
> response time 99th percentile                       2298 (OK=2298   KO=-     )
> mean requests/sec                                     25 (OK=25     KO=-     )
---- Response Time Distribution ------------------------------------------------
> t < 800 ms                                             3 (  3%)
> 800 ms < t < 1200 ms                                  25 ( 25%)
> t > 1200 ms                                           72 ( 72%)
> failed                                                 0 (  0%)
================================================================================
Firstly we see 100 successful requests were made (OK=100) and a really nice breakdown of how my blog is responding if I had a sudden influx of people. But what if I had 100 simultaneous connections for 10 minutes. Well again we change that one line:
From
atOnceUsers(100)
To
constantConcurrentUsers(100).during(10.minutes)
Ok, so this looks a little different. This injection will continuously keep 100 connections active to the blog. This means every time a connection finishes it will start a new connection to take its place, until it reaches the 100 limit. And it will keep doing this for ten (10) minutes.
And again, running Gatling with the same command line:
================================================================================
---- Global Information --------------------------------------------------------
> request count                                      59968 (OK=59967  KO=1     )
> min response time                                     82 (OK=82     KO=11023 )
> max response time                                  13494 (OK=13494  KO=11023 )
> mean response time                                  1000 (OK=1000   KO=11023 )
> std deviation                                        513 (OK=511    KO=0     )
> response time 50th percentile                       1048 (OK=1048   KO=11023 )
> response time 75th percentile                       1235 (OK=1235   KO=11023 )
> response time 95th percentile                       1682 (OK=1682   KO=11023 )
> response time 99th percentile                       2681 (OK=2681   KO=11023 )
> mean requests/sec                                 99.615 (OK=99.613 KO=0.002 )
---- Response Time Distribution ------------------------------------------------
> t < 800 ms                                         22926 ( 38%)
> 800 ms < t < 1200 ms                               19412 ( 32%)
> t > 1200 ms                                        17629 ( 29%)
> failed                                                 1 (  0%)
---- Errors --------------------------------------------------------------------
> i.n.h.s.SslHandshakeTimeoutException: handshake timed out afte      1 (100.0%)
r 10000ms
================================================================================
There was one failure (KO=1) and Gatling nicely tells us why (SSL Handshake Timeout).
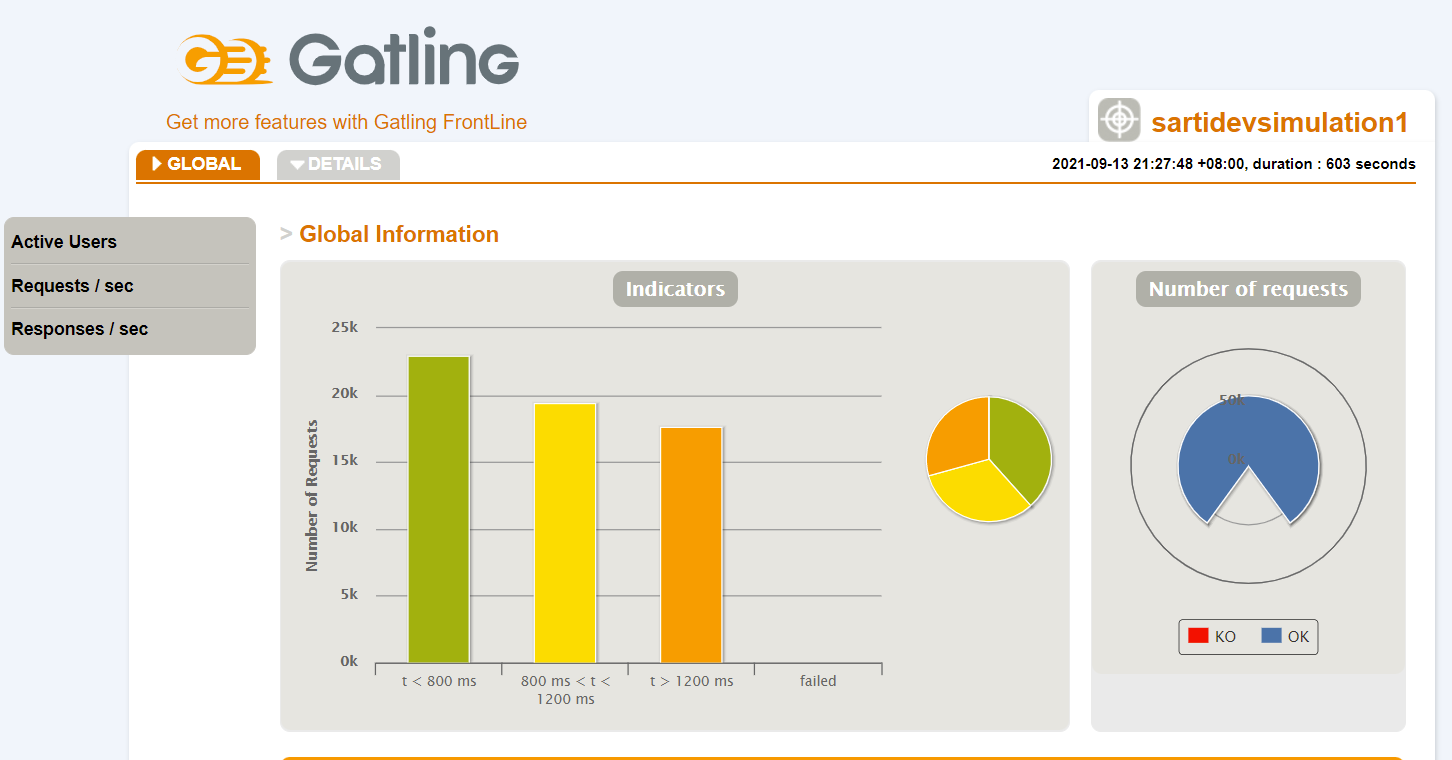
Gatling also outputs some really nice graphs of the results. On the very first example you may have noticed the text at the bottom saying Please open the following file: C:\Source\gatling-charts-highcharts-bundle-3.6.1-bundle\results\s..... This is where Gatling outputs the HTML reports. This report file would probably be published in a CI/CD pipeline. So lets look at the report for the most recent run:
General Overview
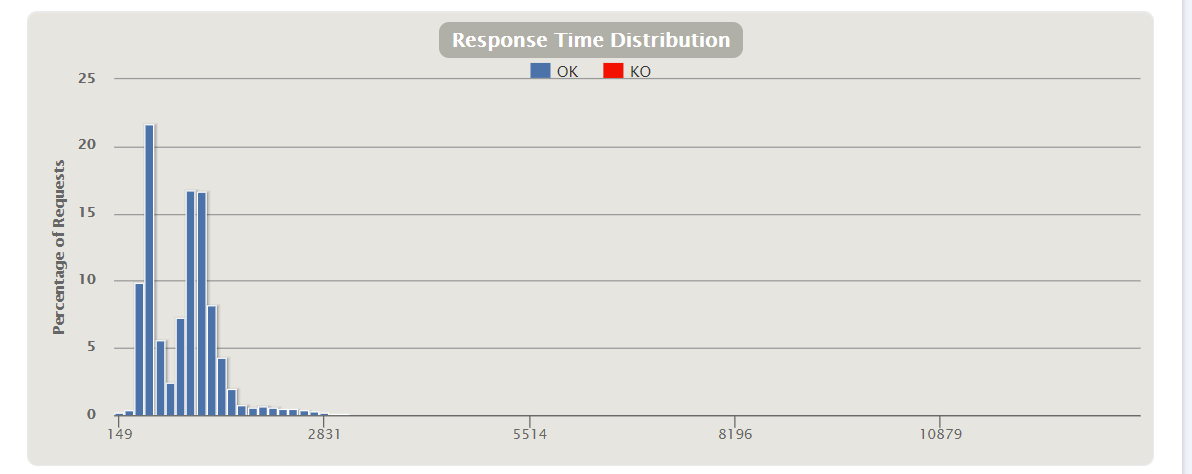
Response Time Distribution
551ms response was the most common
Response Time over the test period
This graph is probably the more interesting as it shows when I received the HTTP error (The red arrow). You can see at that point the response time increased (The multicoloured spikes) and the number of active users dropped (The orange line)
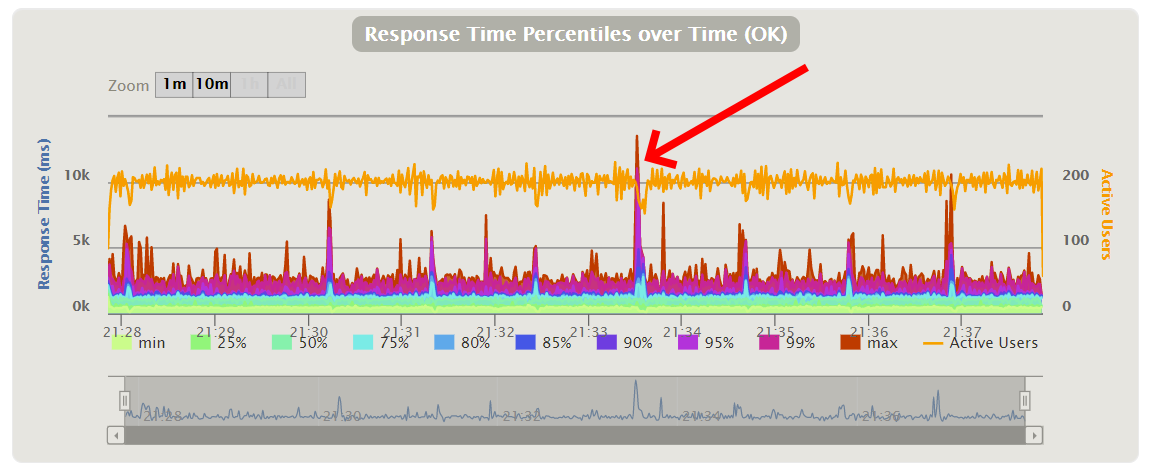
But wait, that graph says I had 200 Active Users, not 100. What gives?
Well, this is due to the Active Users being sampled during one second. Remember that the most common response time was 551ms? Well that means in one second, two connections could be started. That is, in that one second there were two active users. Now what if I had 100 connections going? Well that meant it was likely this was happening to all 100 connections so, 200 Active Users would be average. And that’s what we see in the graph. Really the the name should be “Active Users during a one second window”, but that’s too long to fit on the graph title.
Different injection types
So far we’ve only used atOnceUsers and constantUsersPerSec, but the Gatling Documentation lists many others that you can use, for example:
nothingFor(duration)
Pauses the simulation for a period of time
rampUsersPerSec(rate1) to (rate2) during(duration)
Injects users from starting rate to target rate, defined in users per second, during a given duration. Users will be injected at regular intervals.
Remember that the injections happen sequentially and in-order so you can setup a fairly complex sequence of events for testing, for example, ramp up from 0 to 50 users over 20 minutes, then sustain 50 users for 30 minutes, and finally ramp down from 50 to 0 users over 2 minutes
Different request information
The example above only had a basic request (GET with no headers) but really most requests will have some specific information you need to send, particularly for REST API requests. Let’s say we wanted to call an Azure API Management (APMIM) hosted URL. That needs;
- Header with the APIM Subscription Key
- Content-Type header to specify what is in the payload
- A JSON String Payload
{"userid": 25,"name": "Glenn Sarti"}
The scenario would look like;
val scn = scenario("UpdateUserRequest")
  .exec(
    http("UpdateUserRequest")
      .post("/api/v1/updateUser")
      .header("Ocp-Apim-Subscription-Key", "aaaaaaaa-aaaa-aaaa-aaaa-aaaaaaaaaaaa")
      .header("Content-Type", "application/json")
      .body(StringBody("""{"userid": 25,"name": "Glenn Sarti"}"""))
  )
-
Uses the HTTP POST method
-
Sets up multiple Request Headers
-
Sets the Request Body as a string
You can also use a JSON file instead of a string for the body. For example;
.body(RawFileBody("C:/Source/UserRequest.json"))
Default scenario settings
You can also specify defaults for all scenarios by setting them at the protocol layer. For example;
val httpProtocol = http
  .baseUrl("https://sarti.dev")
  .acceptHeader("text/html,application/xhtml+xml,application/xml;q=0.9,*/*;q=0.8")
  .doNotTrackHeader("1")
  .acceptLanguageHeader("en-US,en;q=0.5")
  .acceptEncodingHeader("gzip, deflate")
  .userAgentHeader("Mozilla/5.0 (Macintosh; Intel Mac OS X 10.8; rv:16.0) Gecko/20100101 Firefox/16.0")
Wrapping up
Gatling can be a very complicated and powerful tool for doing load testing, but starting out doesn’t have to be too difficult. Start out small and simple, and then use the excellent Gatling documentation to help you craft the exact testing scenarios you want to try out.
The gatling simulation file is available on my GitHub repo for my blog https://github.com/glennsarti/code-glennsarti.github.io/tree/master/gatling.


Comments